Introduction
This website began as a personal project to analyze climate trends in Denver, Colorado, where I live. I wanted to understand how global warming was affecting my local area.
After creating the initial Denver climate analysis, I became interested in expanding the project to other regions of the country to compare how different areas are experiencing climate change. This led to the creation of the New York climate analysis section, which uses data from the Central Park weather station, one of the longest continuously operating weather stations in the United States.
The data for this analysis comes from two primary sources: the National Weather Service (NWS) and the National Oceanic and Atmospheric Administration (NOAA). We use data from 1871 to the present, with the 30 year windows making up the "normal" climate baseline. This is why our plots and statistics begin in 1901, allowing us to compare current conditions against this established baseline.
I found that many climate websites focus on either current weather or future projections, but there were fewer resources showing clear, easy-to-understand visualizations of historical climate trends. By creating these visualizations, I hope to make climate data more accessible and help people understand how their local climate is changing over time.
Temperature Trends in New York
Average yearly temperatures in New York over the past several decades:
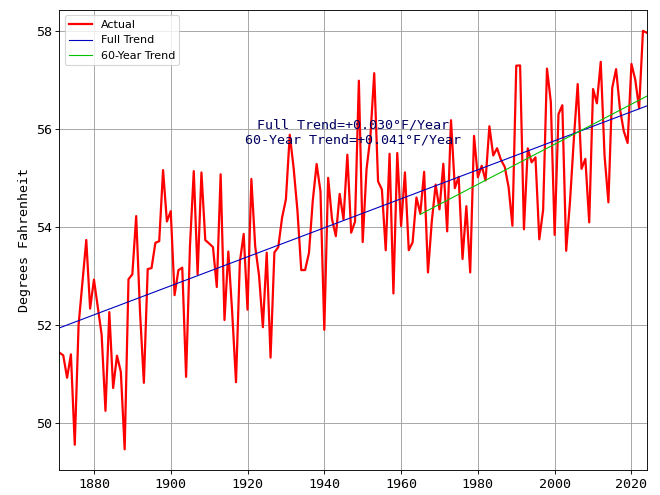
The data reveals a significant warming trend in New York's humid subtropical climate. With one of the longest continuous weather records in the country, dating back to 1871, the data shows a clear increase in average temperatures over time. The plot includes a linear fit for all years from 1871 to present and also includes a linear fit for the last 60 years, showing the temperature trend in degrees per year. These rising temperatures have important implications for New York's urban heat island effect, coastal vulnerability, and energy demands, potentially leading to more frequent heat waves and increased cooling requirements during the summer months.
Precipitation Trends in New York
Total yearly precipitation in New York over the past several decades:
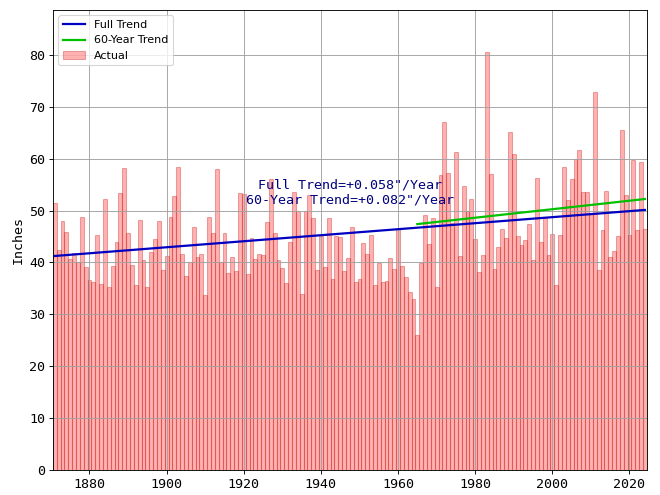
New York's precipitation patterns show notable variations over time. The city's coastal location and urban environment create unique microclimates that influence precipitation patterns. The yearly totals can vary significantly, with some years experiencing drought conditions while others see above-average rainfall, including extreme events like nor'easters and tropical systems. This variability is particularly important for New York's water resources, urban infrastructure, and coastal resilience. The data helps us understand how climate change might be affecting the region's characteristic precipitation patterns and what that means for the future of water management in this densely populated coastal city.